Building attackmap.art
Way back in the forgotten before times (2016), a cybersecurity firm by the name of Norse Corp went a bit belly up, following some undisclosed amount of boardroom backdealing and politics.
None of that really mattered to me, though - what matted a lot more was the eventual shutdown of the Norse Attack Map, a semi-live view of attempts by random servers on the internet attempting to breach Norse's network of global honeypots:
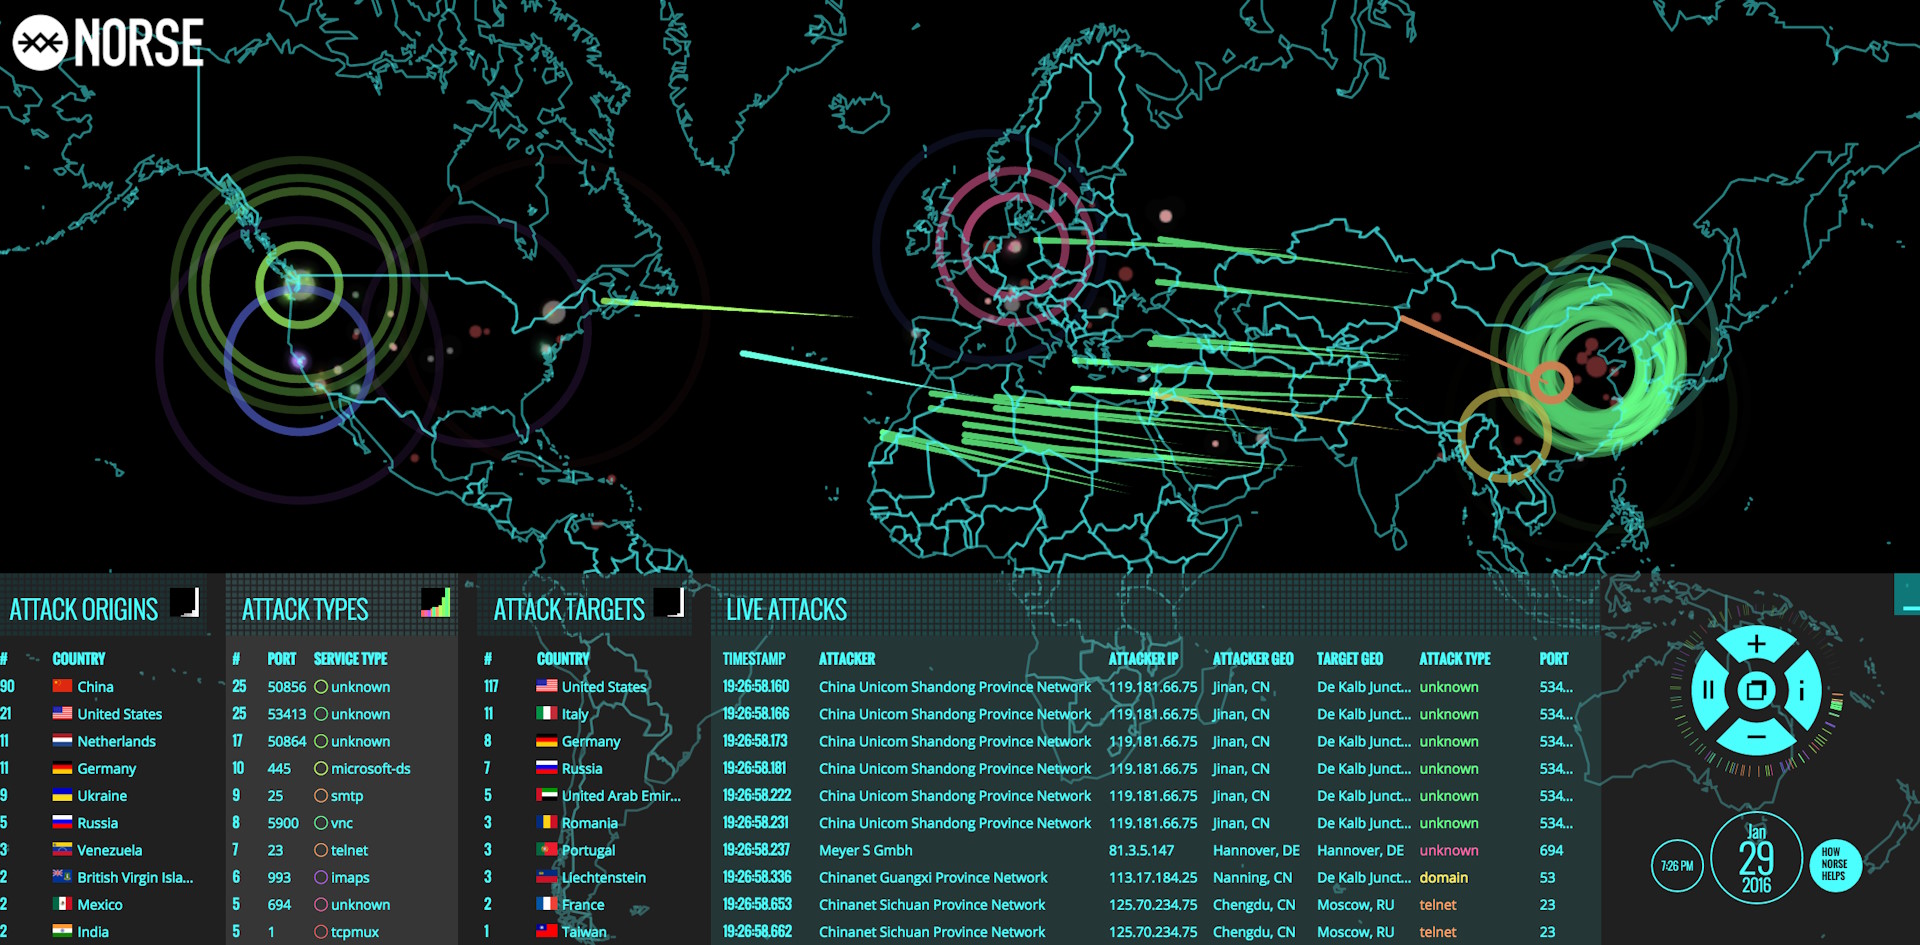
In and of itself, this map was fascinating to watch. A brave soul recorded a few hours worth of it and put it up on YouTube after news came out that the company was on the verge of collapsing.
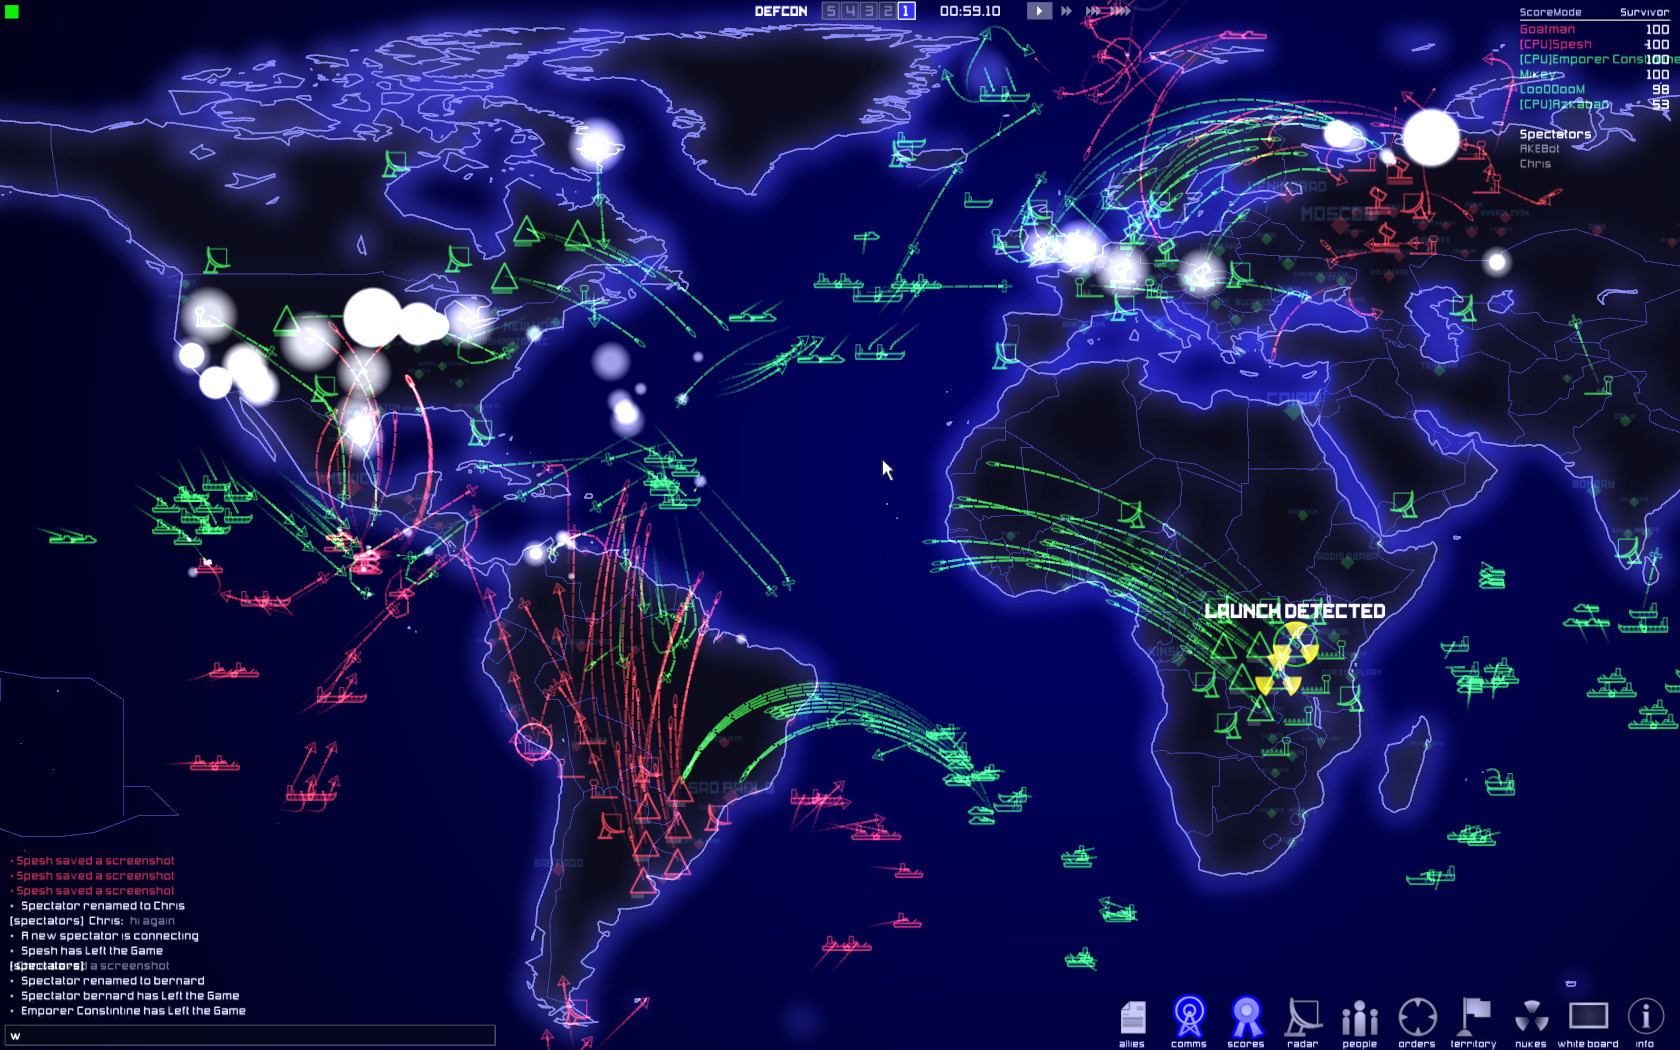
Personally, I always found it something of a noteworthy art piece. I've been a fan of the "minimal cyber retro" aesthetic for a while, especially in relatively-obscure games like Introversion Software's DEFCON:
So with Norse's demise and some free time on my hands, I had a "why the hell not" moment, registered attackmap.art on 22 August 2024 and set about building my own version of what Norse created.
Why bother?
There's a handful of post-fact rationalizations for doing something like this, but the real reason is just that I wanted to. Building things for the hell of it is fun and I believe people should do it more often.
Projects like this do have some utility though, especially when it comes to teaching people about cybersecurity basics: Nothing says "nothing you put on the internet is safe" quite like a map showing, in realtime, how hundreds of different servers around the world are trying their damnedest to find weak points in the stuff you're hosting.
Consequently, a lot of people get bitten by bugs they didn't even know they had, because this stuff is usually not very visible. You read about the odd security breach, but most cybersecurity reporting tends to come in the form of either dry CVE listings or explosively-written journalism.
Yet, cybersecurity is "always on": It doesn't just "happen" when some big company gets breached, or a vulnerability is disclosed in a popular driver (as of today, the most recent one is an old bug in CUPS, the Linux printing driver).
In reality, everything that's online is being probed and scanned 24/7/365. Some of it is innocuous: Survey bots that scan the IPv4 space to see if servers are live, or computers with out-of-date DNS records (or hardcoded IPs!) trying to reach services that no longer exist.
Some of it is downright helpful: Platforms like Shodan, which scan the internet for open ports, providing useful information about common vulnerabilities to cybersecurity researchers (and easily-accessible lists of open webcams, MongoDB clusters and FTP servers for mischevious people to click through).
But a decent chunk of it is nefarious: Spammers trying to find open SMTP relays to blast emails through, botnet operators trying to find exploitable open ports to install malware on, shady operators looking for common web vulnerabilities to install remote crypto miners.
If it were a physical door, your server would be on the receiving end of a never-ending stream of knocks, and that's something that the Norse Attack Map illustrated beautifully. Someday, that's what I hope to re-create.
How it works
Turns out that building something like this relatively (conceptually, anyway), straightforward. The overall architecture is basically made up of two components:
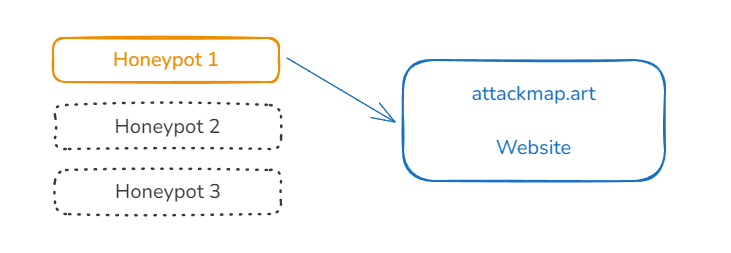
- The Honeypot servers, which sit out on the internet - totally exposed - and wait for incoming connections. When they happen, the connections are closed immediately, and an HTTP POST is done to an endpoint on the main server
- The main server, which processes those incoming requests (primarily for geolocation) and then queues them up for display
1. The honeypot servers
These are super simple in both concept and execution. All you do is:
- Spin up a VPS somewhere - the cheapest one will do
- Turn off all the firewalls, open all the ports
- Write a little bit of software that binds to the ports you want to monitor
- When you get a bite, close the connection immediately and send up an alert
In my case, that software is a straightforward combination of PHP's existing socket library (opening an AF_INET socket per port) with curl to post up the attacker's IP address and the port it came in on.
The list of ports it listens for is slowly expanding as I identify new common ones, but as of this article, it listens for SSH, FTP, Telnet, SMTP, POP3, IMAP, IRC, and SMB.
When I opened it up for HTTP I got a bunch of traffic that wasn't particularly useful to see. I pointed a handful of dead domain names I own to the honeypot IP just to see what would happen, and I got a bunch of crawler traffic (which is legitimate), so I need to do more work to separate out the actually-malicious scanning (like attempts on common admin panel filenames).
From there, the main server geolocates the attack - by using ipinfo.io to resolve the IP to a location and ISP - and then displays the information on the frontend.
2. The visualization layer
This is the thing you actually see on the attackmap.art website. It consists of a Laravel 11 application, and some basic Javascript to render out a world map. To get started quickly, I used OpenStreetMap with Carto's Dark theme, all mediated through LeafletJS, which makes it easy to embed and modify web maps.
The realtime component is managed by Laravel Reverb, which hosts a socket connection to Laravel Echo. From there, between combing through documentation and using Claude 3.5 Sonnet to do some of the thinking for me, I ended up with essentially the heart of the whole thing:
renderAttack(attack) {

    const tbody = document.getElementById('stream-body');

    if (!tbody) {
        return;
    }

    const newRow = tbody.insertRow(0);

    newRow.style.color = this.getAttackColor(attack.type);
    newRow.id = 'attack-' + attack.id;

    // Transform and write the fields we want to display
    (newRow.insertCell()).textContent = attack.timestamp;
    (newRow.insertCell()).textContent = attack.geo;
    (newRow.insertCell()).textContent = attack.ip;
    (newRow.insertCell()).textContent = attack.type;
    (newRow.insertCell()).textContent = attack.isp;

    // Clamp the table
    const table = document.getElementById('stream-table');

    if (table.rows.length >= 20) {

        const lastRow = table.rows[table.rows.length - 1];

        let pingId = lastRow.id.replace('attack-', 'ping-');
        document.getElementById(pingId).remove();

        lastRow.remove();
    }

    // Fire the visual map marker ping
    this.addPing(
        attack.id,
        this.getAttackColor(attack.type),
        attack.lat,
        attack.lon,
    )

}
Where:
stream-bodyis the<tbody>at the bottom of the page, which shows the attack details in a stream- A new row is added with the fields filled into the cells one-by-one
- If the table ends up going longer than 20 rows (which is well off-screen by that point), the rows are deleted from the table to keep the DOM size reasonable, and
addPing()is called, which very simply draws a marker on the map
The markers are simple static pulsing SVG circles right now, rendered out with a straightforward:
addPing(attackId, fillColor, lat, lon) {

    return new Promise((resolve) => {
        const marker = L.circleMarker([lat, lon], {
            radius: 10,
            fillColor: fillColor,
            color: "transparent",
            weight: 0,
            opacity: 1,
            fillOpacity: 0.9
        }).addTo(this.map);

        marker.getElement().classList.add('ping');
        marker.getElement().id = 'ping-' + attackId;

        resolve();
    });

}
And all kicked off by a simple broadcast listener:
window.Echo.channel(`public`)
           .listen('Attack', (e) => {
               AttackStream.renderAttack(e.attack);
           })
This is where Leaflet and OpenStreetMap came in super handy - I didn't have to figure out my own coordinate system for how to correctly map those lat/lon dots to a world map, though eventually I imagine I might have to!
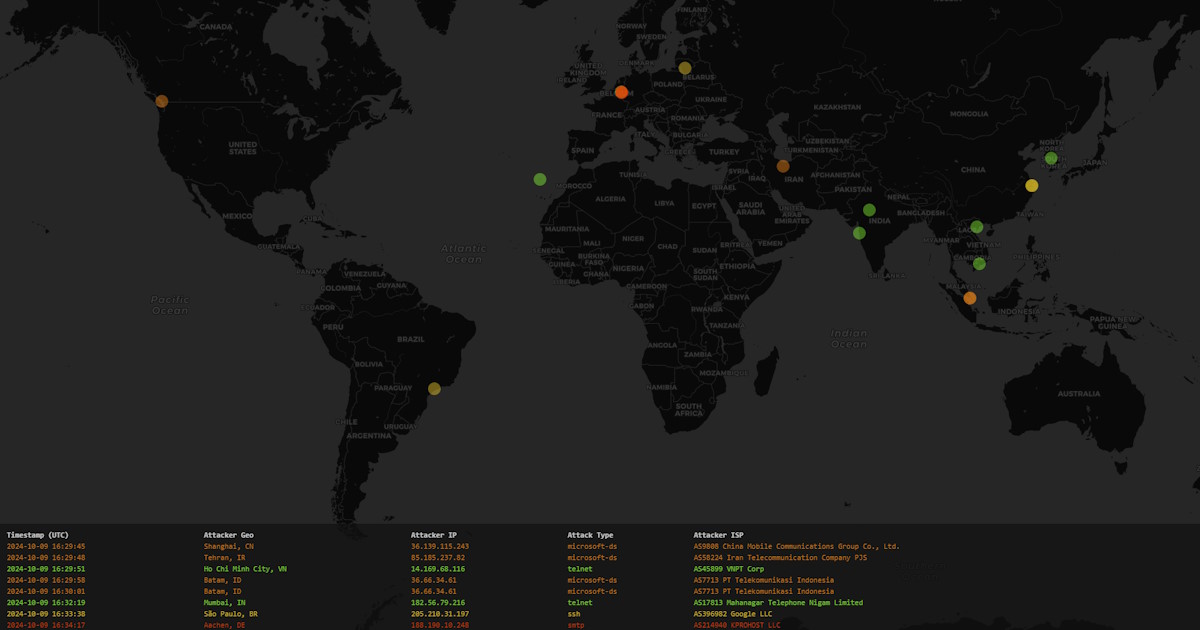
And the end result of all this: A map you can view in your browser, which shows the last 20 incoming attempts to open ports that shouldn't really be opened :)
What's next?
There's a lot I still want to do here! In the long term, I want this to be a permanent art installation of sorts, which is fed by at least 20 geographically-dispersed honeypot servers on a range of different cloud providers (that way, you generate a lot of incoming attack traffic).
The UI also needs at least two major UI overhauls. Right now I'm doing dots-on-map because that was the fastest way to get it done, but I really love the chaotic frenzy of Norse's original design, and will try to emulate that in some fashion. This would likely involve a few late nights getting to grips with SVG, CSS and animations.
And then, of course, the ability to show a lot more than 20 attacks at once. When you initially open the page, the map is hydrated with the last 20 unique IPs that have been attacked, which ends up drawing lots of pretty dots. Leave it open long enough though, and you get runs of incoming pings from the same source, which ends up removing all but a few of the markers. That can be made much more fun!